TEL:+86 132 6656 7067


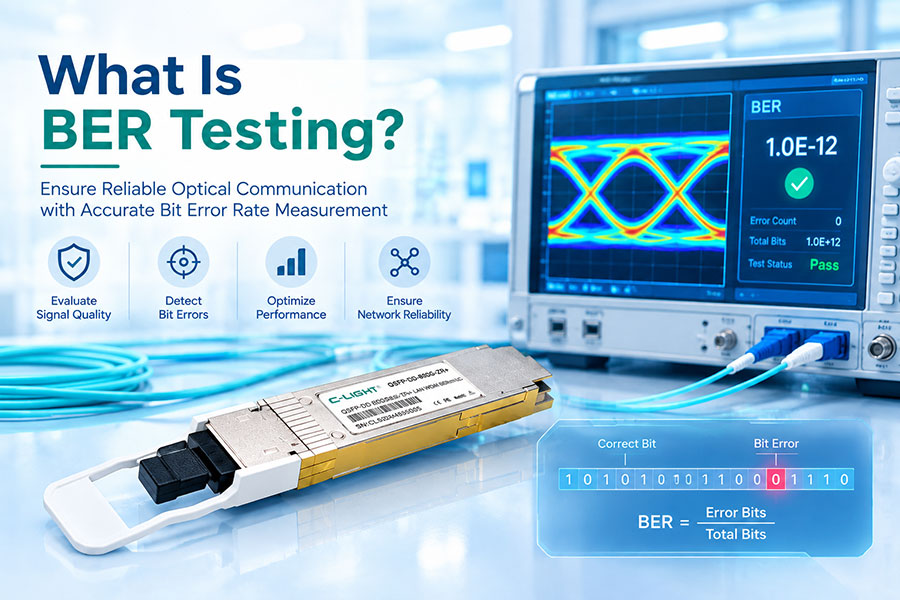
Bit Error Rate (BER) testing is the fundamental measurement of digital link quality. It answers a deceptively simple question: out of all the bits transmitted across a link, how many arrive incorrectly? The answer—expressed as a ratio of errored bits to total bits transmitted—determines whether a link can reliably carry data, whether it meets protocol requirements, and whether it has sufficient margin to operate over its lifetime.
BER testing is not merely a laboratory curiosity. It is the basis for every optical transceiver specification, every high-speed SerDes qualification, and every Ethernet and InfiniBand standard. A 400G transceiver that specifies a pre-FEC BER of 2.4×10⁻⁴ is making a claim that can only be verified through BER testing. A switch ASIC that claims 200G PAM4 SerDes capability is asserting a BER performance that must be measured under controlled conditions. Without BER testing, there is no objective way to compare components, verify interoperability, or predict field reliability.
As data rates advance from 100G to 400G, 800G, and 1.6T, BER testing has become both more important and more challenging. Higher-order modulation like PAM4 operates with reduced noise margins, forward error correction (FEC) has become mandatory rather than optional, and the distinction between pre-FEC and post-FEC BER has become central to system design. Understanding BER testing—what it measures, how it is performed, and how to interpret the results—is essential for anyone working with modern high-speed interconnects.
1. What Is Bit Error Rate?
Bit Error Rate is the ratio of incorrectly received bits to the total number of bits transmitted over a given period. It is a dimensionless quantity, typically expressed in scientific notation: a BER of 1×10⁻¹² means one errored bit for every trillion bits transmitted.
BER is distinct from several related metrics that are sometimes confused with it:
Bit Error Ratio (also BER): The same quantity, though "ratio" emphasizes the dimensionless nature.
Block Error Rate (BLER): The ratio of errored blocks (or codewords) to total blocks, used in FEC analysis.
Frame Error Rate (FER): The ratio of errored frames to total frames, relevant at the protocol layer.
Packet Error Rate (PER): The ratio of errored packets to total packets, used in network-layer measurements.
BER is the most fundamental of these because it operates at the physical layer, before any framing, packetization, or protocol processing. A link's BER determines the raw error rate that higher layers must contend with—and that FEC must correct.
The relationship between BER and practical link performance is direct. A BER of 1×10⁻¹² at 400 Gbps means approximately 0.4 errored bits per second, which is generally acceptable for links protected by FEC. A BER of 1×10⁻⁵ at the same rate means 4 million errored bits per second, which would overwhelm most FEC schemes and render the link unusable.
2. Why BER Testing Matters
BER testing serves several critical functions in the development, qualification, and deployment of high-speed interconnects.
2.1 Component Qualification
Every optical transceiver, SerDes, retimer, and cable assembly has a specified BER performance. BER testing verifies that a component meets its specification across the full range of operating conditions—temperature, voltage, and input signal quality. Without BER testing, there is no way to confirm that a component will perform reliably in the field.
2.2 Link Margin Assessment
BER testing reveals how much margin a link has before errors become unacceptable. By measuring BER as a function of received optical power, signal-to-noise ratio, or timing offset, engineers can determine how much degradation the link can tolerate before failing. This margin analysis is essential for predicting field reliability and for setting manufacturing test limits.
2.3 Interoperability Verification
In multi-vendor data centers, components from different manufacturers must interoperate seamlessly. BER testing provides the objective evidence that a transceiver from Vendor A works correctly with a switch from Vendor B under realistic conditions. Without BER testing, interoperability claims are unverifiable.
2.4 Troubleshooting and Root Cause Analysis
When a link fails in the field, BER testing is often the first diagnostic step. By measuring BER and comparing it to expected values, engineers can determine whether the failure is due to a component defect, a fiber issue, a connector problem, or an environmental factor. BER testing isolates the problem to a specific link segment or component.
3. How BER Is Measured
BER measurement requires a known pattern of transmitted bits and a receiver capable of comparing the received bits to the expected pattern. The instrument that performs this function is called a Bit Error Rate Tester (BERT).
3.1 The Basic BERT Architecture
A BERT consists of two main components:
Pattern Generator: Produces a known sequence of bits—the test pattern—at the desired data rate and format. The pattern may be a pseudo-random bit sequence (PRBS), a predefined stress pattern, or a captured real-world data stream.
Error Detector: Receives the signal under test, recovers the clock and data, and compares the received bit sequence to the expected pattern. It counts the number of mismatches (errors) and the total number of bits received.
The BERT calculates BER as the ratio of errors to total bits. The measurement continues until a sufficient number of bits have been transmitted to achieve statistical confidence in the result.
3.2 PRBS Patterns
Pseudo-Random Bit Sequences (PRBS) are the most common test patterns used in BER testing. They are deterministic sequences that approximate random data while being reproducible and predictable, allowing the error detector to synchronize with the pattern generator.
Common PRBS patterns include:
| Pattern | Sequence Length | Typical Application |
|---|---|---|
| PRBS7 | 2⁷ - 1 = 127 bits | Low-speed links, basic testing |
| PRBS9 | 2⁹ - 1 = 511 bits | Intermediate testing |
| PRBS15 | 2¹⁵ - 1 = 32,767 bits | Standard compliance testing |
| PRBS23 | 2²³ - 1 = 8,388,607 bits | High-speed Ethernet, long-run testing |
| PRBS31 | 2³¹ - 1 = 2,147,483,647 bits | Stringent testing, Jitter tolerance |
| PRBS13Q | PAM4-specific | PAM4 signal testing |
| PRBS31Q | PAM4-specific | PAM4 stress testing |
Longer PRBS patterns are more demanding because they contain longer runs of identical bits and more low-frequency content, which stresses the AC coupling and baseline wander performance of the link. PRBS31 and PRBS31Q are commonly used for 400G and 800G testing because they closely approximate real data traffic.
3.3 Measurement Duration and Statistical Confidence
BER measurement is a statistical process. To claim a BER of 1×10⁻¹² with confidence, one must transmit enough bits to observe a statistically significant number of errors—or to establish an upper bound on the error rate if no errors are observed.
A common rule of thumb is that the measurement should continue until at least 100 errors are observed, or until the number of bits transmitted is at least 10× the inverse of the target BER. For a target BER of 1×10⁻¹², this means transmitting at least 1×10¹³ bits—about 2 hours at 1.6 Tbps. For a target BER of 1×10⁻¹⁵, the measurement would require 1×10¹⁶ bits—about 100 minutes at 1.6 Tbps, or more than 27 hours at 100 Gbps.
In practice, many production tests use shorter measurement durations and accept lower statistical confidence, relying on FEC to handle the residual error rate. For pre-FEC BER targets of 1×10⁻⁴ to 1×10⁻⁶, measurement times are much shorter—seconds to minutes—making high-volume testing practical.
4. Pre-FEC vs. Post-FEC BER
The distinction between pre-FEC and post-FEC BER is one of the most important concepts in modern high-speed interconnect testing. It reflects the reality that virtually all high-speed links now use forward error correction to correct errors that occur during transmission.
4.1 Pre-FEC BER
Pre-FEC BER is the raw error rate measured before forward error correction is applied. It represents the intrinsic quality of the physical link—the errors that occur due to noise, jitter, dispersion, and other impairments. Pre-FEC BER is the metric that component and system vendors specify because it directly reflects the performance of the hardware.
For PAM4-based links at 400G and above, typical pre-FEC BER targets range from 1×10⁻⁴ to 1×10⁻⁶, depending on the FEC scheme and the link architecture. These targets are deliberately higher than the post-FEC BER because FEC is designed to correct them.
4.2 Post-FEC BER
Post-FEC BER is the error rate after forward error correction has been applied. It represents the residual errors that the FEC could not correct. Post-FEC BER targets are typically much lower than pre-FEC targets—often 1×10⁻¹² or better—because these errors propagate to higher layers and can cause packet loss, retransmissions, or link failures.
For Ethernet and InfiniBand links, post-FEC BER of 1×10⁻¹² or 1×10⁻¹⁵ is typically required, depending on the protocol and application. FEC schemes are designed to achieve these post-FEC targets given a specified pre-FEC BER and a specified noise distribution.
4.3 The Relationship Between Pre-FEC and Post-FEC BER
The relationship between pre-FEC and post-FEC BER depends on the FEC scheme, the error distribution, and the implementation. For a given FEC scheme, there is a threshold pre-FEC BER above which the FEC cannot correct all errors and the post-FEC BER rises rapidly.
| FEC Scheme | Typical Coding Gain | Pre-FEC BER Threshold | Post-FEC BER Target |
|---|---|---|---|
| KP4 FEC (RS(544,514)) | ~2.7 dB | ~2.4×10⁻⁴ | 1×10⁻¹⁵ or better |
| 25% OH SD-FEC | ~5–6 dB | ~1×10⁻² | 1×10⁻¹⁵ or better |
| Concatenated FEC | ~8–10 dB | ~1×10⁻² to 1×10⁻¹ | 1×10⁻¹⁵ or better |
The waterfall curve—a plot of post-FEC BER versus pre-FEC BER—shows a steep transition from acceptable to unacceptable performance. Below the threshold, post-FEC BER remains very low. Above the threshold, it rises rapidly. This threshold behavior is why pre-FEC BER specifications are so tightly controlled: operating just a few tenths of a dB above the threshold can cause the link to fail completely.
5. Eye Diagrams and BER
The eye diagram is the most widely used visualization of signal quality in high-speed links, and it is intimately related to BER. An eye diagram is formed by overlaying many bit periods of a signal on top of each other, creating a pattern that resembles a human eye.
5.1 What the Eye Diagram Shows
The eye diagram reveals several key signal characteristics:
Eye Height: The vertical opening of the eye, which indicates the noise margin of the signal. A larger eye height means greater immunity to amplitude noise.
Eye Width: The horizontal opening of the eye, which indicates the timing margin. A wider eye means greater immunity to jitter and timing errors.
Crossing Percentage: Where the rising and falling edges cross, relative to the signal amplitude. This indicates the duty cycle distortion and rise/fall time balance.
Jitter: The horizontal spread of the eye crossings, which indicates timing uncertainty.
Noise: The vertical thickness of the eye, which indicates amplitude uncertainty.
A "clean" eye diagram—large eye height, wide eye width, thin lines—indicates a high-quality signal with a low BER. A "closed" eye—small eye height, narrow eye width, thick lines—indicates a degraded signal with a high BER.
5.2 From Eye Diagram to BER: The Bathtub Curve
The bathtub curve is a plot of BER versus sampling time offset. It is generated by measuring BER at many different sampling points across the bit period and plotting the results on a logarithmic scale. The resulting curve resembles a bathtub: low BER in the center of the bit period, rising steeply at the edges.
The bathtub curve provides two critical pieces of information:
Horizontal Eye Opening: The width of the region where BER is below a specified threshold. This is the timing margin of the link.
BER at Optimal Sampling Point: The minimum BER, which occurs at the center of the eye.
By extrapolating the bathtub curve to lower BER values, engineers can estimate the BER at the target confidence level without measuring for impractically long periods. This extrapolation assumes that the error distribution is Gaussian, which is often—but not always—a valid approximation.
6. BER Testing for PAM4 Signals
PAM4 modulation introduces unique challenges for BER testing. Unlike NRZ, which has a single eye, PAM4 has three eyes—one between each pair of adjacent levels. Each eye has its own BER characteristics, and the overall link BER is determined by the worst-performing eye.
6.1 Three Eyes, One BER
For a PAM4 signal with levels 0, 1, 2, and 3, the three eyes are:
Eye 0-1: Between level 0 and level 1
Eye 1-2: Between level 1 and level 2
Eye 2-3: Between level 2 and level 3
The overall BER is the average of the BERs of the three eyes, weighted by the probability of each symbol transition. However, in practice, the eyes are not equal. The outer eyes (0-1 and 2-3) are often more susceptible to compression and nonlinearity, while the middle eye (1-2) may suffer from different impairments. BER testing must characterize all three eyes to ensure that the link meets its overall BER specification.
6.2 PAM4 Test Patterns
PAM4 BER testing uses PAM4-specific test patterns, such as PRBS13Q and PRBS31Q, which are designed to stress the PAM4 signal in ways that NRZ patterns cannot. These patterns include symbol sequences that exercise all possible transitions and levels, ensuring comprehensive coverage of the PAM4 signal space.
6.3 FEC-Aware BER Testing
Because PAM4 links at 400G and above rely on FEC, BER testing for these links must be FEC-aware. This means measuring pre-FEC BER against the FEC threshold, not against an arbitrary low target. A PAM4 link that achieves a pre-FEC BER of 1×10⁻⁵ may be perfectly acceptable if the FEC threshold is 2.4×10⁻⁴, but it would be unacceptable if the FEC threshold were 1×10⁻⁶.
FEC-aware BER testing also involves measuring the error distribution, not just the average error rate. Burst errors—consecutive errors that occur in a short period—are more difficult for FEC to correct than random errors at the same average rate. Some FEC schemes are designed to handle burst errors, while others are optimized for random errors. BER testing should characterize both the average rate and the burstiness of the errors.
7. BER Targets for Modern Data Rates
BER targets vary by application, protocol, and FEC scheme. The following table summarizes typical pre-FEC and post-FEC BER targets for common data rates.
| Data Rate | Modulation | Typical Pre-FEC BER Target | Typical Post-FEC BER Target | Common FEC |
|---|---|---|---|---|
| 10G–25G | NRZ | 1×10⁻¹² | 1×10⁻¹² | None or KP4 |
| 100G | NRZ or PAM4 | 1×10⁻⁵ to 1×10⁻⁶ | 1×10⁻¹² to 1×10⁻¹⁵ | KP4 or RS-FEC |
| 400G | 50G PAM4 | 2.4×10⁻⁴ | 1×10⁻¹⁵ or better | KP4 or 25% OH SD-FEC |
| 800G | 100G PAM4 | 2.4×10⁻⁴ | 1×10⁻¹⁵ or better | KP4 or 25% OH SD-FEC |
| 1.6T | 200G PAM4 | 1×10⁻⁴ to 1×10⁻⁵ | 1×10⁻¹⁵ or better | 25% OH SD-FEC or stronger |
These targets are not arbitrary. They are derived from the FEC scheme's correction capability, the protocol's error tolerance, and the link's operating margin. A pre-FEC BER target that is too high will exceed the FEC threshold under worst-case conditions. A target that is too low will unnecessarily increase component cost and reduce manufacturing yield.
8. BER Testing Methodologies
BER testing can be performed using several different methodologies, each suited to different stages of development, qualification, and production.
8.1 Full BERT Testing
Full BERT testing uses a dedicated pattern generator and error detector to measure BER directly. It provides the highest accuracy and the most comprehensive characterization, but it requires expensive test equipment and significant test time. Full BERT is typically used for component qualification, design validation, and root-cause analysis.
8.2 Eye Diagram and Bathtub Curve Testing
Eye diagram and bathtub curve testing use a sampling oscilloscope or a real-time oscilloscope to capture the signal and analyze its quality. These methods do not measure BER directly but provide estimates based on signal quality metrics. They are faster than full BERT and are commonly used in production testing and field diagnostics.
8.3 FEC-Based BER Estimation
Many modern transceivers and switch ASICs include FEC circuitry that can report pre-FEC BER and post-FEC BER in real time. This built-in capability allows BER monitoring without external test equipment, making it possible to track link health continuously in production networks. FEC-based BER estimation is less accurate than full BERT but is sufficient for monitoring and trend analysis.
8.4 Stress Testing
BER testing under stress conditions—elevated temperature, reduced supply voltage, worst-case pattern, maximum reach—is essential for verifying that a link meets its specifications across all operating conditions. Stress testing reveals marginal designs that pass under nominal conditions but fail in the field.
| Methodology | Accuracy | Speed | Equipment Cost | Typical Use |
|---|---|---|---|---|
| Full BERT | Highest | Slowest | Highest | Qualification, root cause |
| Eye/Bathtub | High | Fast | High | Production, diagnostics |
| FEC-Based | Moderate | Real-time | Low | Monitoring, trend analysis |
| Stress Test | Highest | Slowest | Highest | Margin verification |
9. Practical Considerations in BER Testing
BER testing is not simply a matter of connecting a BERT and reading a number. Several practical considerations affect the accuracy and relevance of the measurement.
9.1 Pattern Synchronization
The error detector must synchronize with the pattern generator to compare received bits to expected bits. This synchronization requires a detectable pattern and a reliable clock recovery mechanism. In high-speed links with significant jitter or loss, synchronization can be challenging, and loss of synchronization can be mistaken for a high error rate.
9.2 Error Floor
Some links exhibit an error floor—a BER below which the error rate does not decrease even as signal quality improves. Error floors are caused by deterministic impairments such as crosstalk, reflections, or pattern-dependent effects. They cannot be corrected by increasing signal power or reducing random noise. BER testing should characterize the error floor and ensure that it is below the target BER.
9.3 Burst Errors
Burst errors—consecutive errored bits—are more challenging for FEC than random errors at the same average rate. BER testing should measure not only the average error rate but also the error distribution. Some BERTs provide burst error analysis, reporting metrics such as burst length distribution and error-free interval distribution.
9.4 Temperature and Voltage Effects
BER varies with temperature and supply voltage. A link that meets its BER specification at 25°C may fail at 70°C or at reduced supply voltage. BER testing should be performed across the full operating temperature and voltage range, with margin for aging and manufacturing variation.
9.5 Test Time vs. Confidence
There is an inherent trade-off between test time and statistical confidence. Measuring a BER of 1×10⁻¹⁵ with 100 observed errors would require transmitting 1×10¹⁷ bits—more than 17 hours at 1.6 Tbps. In production, shorter test times with lower confidence are used, and FEC provides the margin to handle the residual risk. In qualification, longer test times with higher confidence are justified.
10. BER Testing in AI Data Centers
AI data centers place unique demands on BER testing. GPU clusters generate massive east-west traffic, training jobs are sensitive to latency and jitter, and the sheer number of links means that even a small percentage of marginal links can cause significant performance degradation.
10.1 High Link Counts
A large AI cluster may contain tens of thousands of high-speed links. Testing every link with full BERT is impractical. Instead, production testing relies on a combination of sampling, FEC-based monitoring, and system-level validation. Links that pass manufacturing test are expected to operate reliably in the field, with FEC providing margin for aging and environmental variation.
10.2 Latency Sensitivity
AI training workloads are sensitive to latency and jitter. A link with a high pre-FEC BER may still meet its post-FEC BER target, but the FEC processing adds latency. For latency-critical applications, BER testing should characterize not only the error rate but also the latency implications of the FEC scheme.
10.3 Reliability Prediction
BER testing provides the data needed to predict field reliability. By measuring BER across temperature, voltage, and time, engineers can estimate the link's margin and predict the probability of field failure. This information is essential for setting warranty periods, planning maintenance, and designing redundant paths.
11. The Future of BER Testing
As data rates advance toward 1.6T and 3.2T, BER testing continues to evolve. Higher speeds mean shorter bit periods, tighter timing margins, and greater sensitivity to jitter and noise. PAM4 and higher-order modulation formats make BER testing more complex, requiring multi-eye analysis and FEC-aware methodologies.
Several trends are shaping the future of BER testing:
Integrated FEC Monitoring: Transceivers and switch ASICs increasingly include FEC circuitry that reports BER in real time, reducing the need for external test equipment.
Machine Learning for Error Analysis: ML algorithms are being applied to BER data to identify patterns, predict failures, and optimize link parameters.
Higher-Speed BERTs: Test equipment vendors are developing BERTs for 1.6T and 3.2T rates, with support for PAM4 and higher-order modulation.
In-System Testing: Rather than removing components for bench testing, in-system BER testing allows links to be characterized in their actual operating environment.
Despite these advances, the fundamental purpose of BER testing remains unchanged: to measure the error rate of a digital link and to determine whether it meets its specification. As long as data is transmitted digitally, BER testing will be essential.
12.Conclusion
BER testing measures the ratio of incorrectly received bits to total bits transmitted, providing the fundamental metric of digital link quality. It is used for component qualification, link margin assessment, interoperability verification, and troubleshooting. Modern BER testing must account for forward error correction, distinguishing between pre-FEC BER (the raw error rate before correction) and post-FEC BER (the residual error rate after correction).
As data rates advance from 400G to 800G to 1.6T, BER testing becomes both more important and more challenging. PAM4 modulation introduces three eyes per link, each requiring separate characterization. FEC has become mandatory, making FEC-aware BER testing essential. And the sheer number of links in AI data centers makes continuous BER monitoring a practical necessity.
The bathtub curve, the eye diagram, and the waterfall curve remain the fundamental tools of BER analysis. Whether measured with a dedicated BERT, estimated from an eye diagram, or monitored through built-in FEC circuitry, BER provides the objective evidence that a link can reliably carry data. Without it, high-speed interconnect design would be guesswork.
 >
>

 >
>
 >
>
 >
>
 >
>
 >
>
 >
>
 >
>